
Potential EFFR / SOFR mispricing
ZQ and SR1 contracts
ZQ, SR1 contracts both need two assumptions to work. One is the odds of change in Fed policy, and the other is where the EFFR (or SOFR respectively) will trade. There is a third assumption needed which is way more certain (as described below), and that is that rates will adjust by the same amount that the next Cut/Hold/Hike will be in the Fed's target range. (ie if EFFR (Effective Fed Fund Rate) is 387 now, and there is a 25bps cut on Dec-10, it will adjust to 362).
Currently ZQZ5 contracts are priced at 96.2275, implying an average EFFR rate of 3.77% during December.
Polymarket is implying a 70% chance solely on a 25bps cut.
If we apply the binary odds to the ZQ5 contract (taking out the policy assumptions out of the equation), the current price is implying that EFFR will sustainably hold on to the 79th percentile of the Fed target range. (ie 394.7 currently).
The math is straightforward, since ZQZ5 is quoted in: price = 100 - R (where R - average EFFR during December)
Current price of 96.23 -> implied EFFR -> 3.77% -> 30% chance of 3.94% and 70% chance of 3.69% , assuming that in case of Cut, the adjustment will be 25bps.
Based on precedent, on average, EFFR adjusts by 0.1bps less than the Fed target does when the Fed changes its target range.
This assumes that EFFR will sustainably stay above IORB levels (currently set at 3.9%) for a whole month.
The IORB (Interest on Reserve Balances) is the rate banks earn on money parked at the Fed. It can create a small arbitrage opportunity when the banking system has ample reserves. This arbitrage disappears when reserves become scarce and cash is in high demand, a situation often seen during Quantitative Tightening (QT) or bank runs.
Looking at precedent of EFFR vs Boundaries and EFFR vs IORB
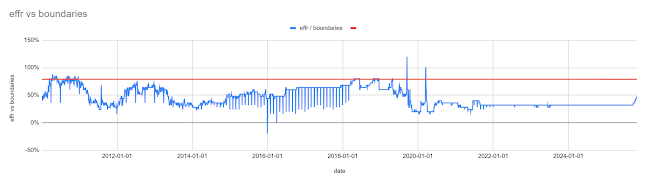
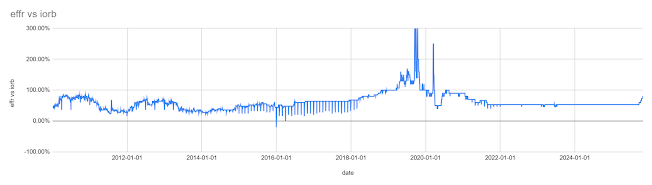
An "easy" way to isolate this would be to hedge the policy odds and leave exposure solely to the EFFR movement implied by the ZQ contract. Polymarket and Kalshi however can only offer around $200k worth of exposure, making that route not really scalable to bigger volumes. Another route is isolating the exposure through levered index contracts that borrow at EFFR, by hedging the index itself, thus leaving exposure only to EFFR financing costs and comparing them to the ones implied by the ZQZ5 contract.
Similarly, the SR1Z5 contract has the same pricing mechanism with ZQZ5 but replaces EFFR with SOFR (Secured Overnight Financing Rate)
The current SR1 price is implying a (bit) more realistic SOFR but still high. If we do the same calculation using the implied 70% odds of Fed cut, the market is pricing in a SOFR sitting around a current level of 4.04% (has been around 4.2% the past few days, 3.91% as of time of writing) which corresponds to a 118% level compared to the target range. Something a bit more common as seen below.
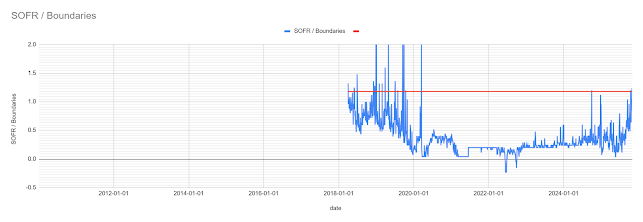
Nonetheless, the two contracts combined, are pricing in that EFFR will move more than the SOFR will, or that the SOFR will stay almost stable, while the EFFR spikes. This sounds fundamentally incorrect, since both instruments are influenced by the same events that react differently.
This happens because the EFFR is a "managed" rate, while the SOFR is a "market" rate.
The Federal Reserve uses its tools, like Interest on Reserve Balances (IORB), to create a tight "corridor" that keeps the EFFR stable.
SOFR, on the other hand, is based on the huge, real-world repo market. This market includes a wider range of players, like hedge funds, who don't have access to the Fed's stabilizing tools. When cash is scarce, these players must pay whatever it takes to get funding, causing the market-driven SOFR to spike dramatically.
This is evident by the relationship between the two relatively to the equivalent target rate
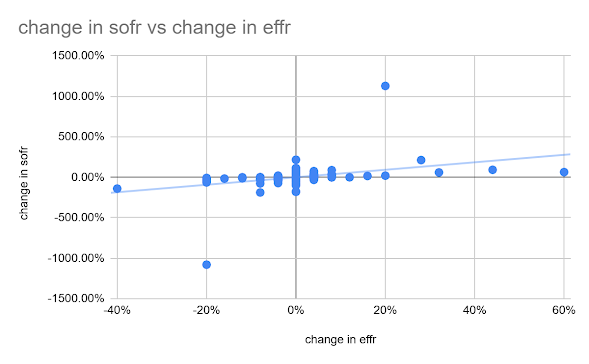
Historically, (based on the precedent available), a sudden spike in EFFR, always means an even bigger spike in SOFR. The graph above shows a slope of 4.6, meaning that should the EFFR indeed move to ~3.94%, SOFR should move to a predicted ~4.23%. Or vise versa, should the SOFR move to 4.04%, the EFFR should only rise to ~3.89%.
(4.6 slope example: if both SOFR and EFFR sit at 50% of the target rate range, ie 3.825% right now, if EFFR moves to 51% of the range, SOFR should rise to 54.6%)
The structure that isolates this is long the ZQZ5 contract and short the SR1 (recall that when EFFR falls, ZQ gains)
Let's look at a couple of scenarios (bid/ask adjusted)
Returns depend on margin requirements by each broker and maximum assumed drawdown. The tables below use an illustrative $5k.
EFFR stays at current levels, with SOFR market prediction being correct (main thesis)
| CUT RATES | HOLD RATES | |
|---|---|---|
| Long ZQ | 208.3 | -500.0 |
| Short SR1 | 20.8 | 729.2 |
| P/L | 229.2 | 229.2 |
| Capital required (ibkr) | 5000.0 | 5000.0 |
| Return | 4.58% | 4.58% |
| IRR | 35.38% | 35.38% |
Market is correct about EFFR prediction (3.94%) and the relative SOFR prediction is correct (SOFR moves even higher)
| CUT RATES | HOLD RATES | |
|---|---|---|
| Long ZQ | -10.4 | -718.7 |
| Short SR1 | 791.7 | 1489.6 |
| P/L | 781.3 | 770.8 |
| Capital required (ibkr) | 5000.0 | 5000.0 |
| Return | 15.63% | 15.42% |
| IRR | 166.80% | 163.57% |
EFFR drops and with SOFR staying constant
| CUT RATES | HOLD RATES | |
|---|---|---|
| Long ZQ | 572.9 | -135.4 |
| Short SR1 | -562.5 | 145.8 |
| P/L | 10.4 | 10.4 |
| Capital required (ibkr) | 5000.0 | 5000.0 |
| Return | 0.21% | 0.21% |
| IRR | 1.42% | 1.42% |
Market is currently correct about both SOFR and EFFR
| CUT RATES | HOLD RATES | |
|---|---|---|
| Long ZQ | -10.4 | -718.7 |
| Short SR1 | -52.1 | 656.2 |
| P/L | -62.5 | -62.5 |
| Capital required (ibkr) | 5000.0 | 5000.0 |
| Return | -1.25% | -1.25% |
| IRR | -8.15% | -8.15% |
EFFR and SOFR stay in today's levels
| CUT RATES | HOLD RATES | |
|---|---|---|
| Long ZQ | 281.2 | -427.1 |
| Short SR1 | -562.5 | 145.8 |
| P/L | -281.3 | -281.3 |
| Capital required (ibkr) | 5000.0 | 5000.0 |
| Return | -5.63% | -5.63% |
| IRR | -32.38% | -32.38% |
Both EFFR and SOFR move against the thesis
| CUT RATES | HOLD RATES | |
|---|---|---|
| Long ZQ | -166.7 | -875.0 |
| Short SR1 | -145.8 | 562.5 |
| P/L | -312.5 | -312.5 |
| Capital required (ibkr)*2 | 5000.0 | 5000.0 |
| Return | -6.25% | -6.25% |
| IRR | -35.35% | -35.35% |
There are numerous scenarios which we can speculate on.
The main inefficiency we are identifying today is that the market is pricing a higher impact of a cash shortage on EFFR than it does on SOFR, with EFFR staying sustainably over IORB for a month.
It is very hard to have a view on actual cash liquidity as it may depend on idiosyncratic events like tax payments, Bond maturities or market panic.