
Explaining the Past Is Not Predicting the Future
This week was meant to make the regime model predict. Mostly it produced things that don't, plus one bug that pretended to. The throughline, which only became clear partway through, is the difference between explaining the past and predicting the future — they are not the same, and only the second is worth anything.
Two ways to use a Transformer, both dead
The Transformer was supposed to read a multi-month window and help the model see a shock building. We tried it as a forecaster first — predict the next few days of the volatility features — in three variants (levels, changes, raw inputs). All three failed the same way: hyperactive, always predicting change on calm bars, no edge at the turns. On the inflection bars that actually matter — where simple momentum is mechanically wrong — it beat momentum on 9% of 2018 bars and 5% of COVID bars, with direction right about 52% of the time. A coin flip. The diagnosis was not the loss function but the question: "where will the VIX be in five days" is something the market has already priced, and a small model on free data is not going to beat that consensus.
So we changed the question — stop forecasting the features, recognise the regime. We trained the Transformer with contrastive learning to map each 90-bar window to a point in a small space where similar regimes sit close together; the market doesn't price regime labels, so the model wouldn't be competing with consensus. The smoke test looked clean — similarity decayed smoothly with time, exactly as it should. Then we computed the numbers it was supposed to deliver, and they went the wrong way: the stress-period windows landed closer to the all-period average than ordinary calm days did, and not one stress day cleared the 95th percentile of distance. The loss had enforced temporal smoothness and nothing about stress. We retracted the "clean separation" reading — it had come from eyeballing a plot, not measuring it — and dropped the auxiliary Transformer line. The thing that did help was duller: feed the term-structure features straight into the model's emissions instead of through a side network, which unlocked the state count the earlier model was stuck at.
The question that reorganised the week
Then the one that mattered. Asked whether our regime-detection scores were forward-looking or backward-looking, we found that for weeks every "detection" number had been grading the nowcast — the model's read of today using today's data — and quietly discarding the forecast, its read of tomorrow available before tomorrow opens. The nowcast explains the past. Only the forecast is tradable, and the model had been computing it at every step and throwing it away. Aligning the scorecard to the forecast also surfaced a one-bar conditioning bug: the transition model was trained on "yesterday's inputs decide today" but replayed as "today's inputs decide today," so it was being run under conditions it had never been fit under. Fixed both ends to the same rule.
What the forecast is, judged honestly
Graded as a forecaster against the actual market — not against its own nowcast, which was the second correction of the week — it has a faint, lopsided edge: on the bars where it disagrees with the nowcast, it is right about 60% of the time coming out of a trough and only 36% going into a peak, a 24-point asymmetry. Encouraging, with two caveats we attached immediately: the 2020 V-recovery was too fast for it (a tie there), and the absolute differences between forecast and nowcast were tiny. An asymmetry on disagreement bars is not yet money.
Where it actually died: the economic test
So we put it to the cheapest economic test — size it and see if it makes anything. The forecast layer loses money essentially everywhere; the best it managed on a full window was under a percent. The nowcast version makes money — but only on raw inputs (smoothing the inputs first destroys the timing), and it makes it all in the selloff and gives most of it back in the recovery:
| Late-2018 window | passive | nowcast Kelly | forecast Kelly |
|---|---|---|---|
| selloff (129 bars) | −16.9% | +19.6% | +16.7% |
| recovery (130 bars) | +17.1% | −6.7% | −15.5% |
The asymmetric finding doesn't survive: as a tradable strategy the forecast is the worst performer through recoveries, the opposite of the directional result. The cause is structural. The trained transition matrix has a dominant pull back toward the stress state — whenever the model lands in its middle regime it adds twenty-odd points of weight to stress on the next step, flipping the bet from long to short. It had learned the common path, calm to middle to stress, and never learned that the middle regime is also where recoveries live. It is fluent in the way down and tongue-tied on the way back up.
Sizing, briefly
A detour to rule sizing in or out. Full Kelly on these regimes is untradeable — the per-state edges imply tens of times leverage, so the clip to ±1 binds on about 99% of bars and "Kelly sizing" degenerates into betting the sign at full size. A principled target-free alternative (scale by conviction times edge) produces a genuine risk-adjusted edge but positions averaging 2.5% — real Sharpe, invisible return. Either way the conclusion is the same: sizing moves the leverage, not the quality of the signal. It is the second problem; recovery detection is the first.
The bug that pretended to be an edge
Mid-week a feature screen turned up a champion — one front-of-curve volatility signal that looked extraordinary: a separating power of +9.47, stable across sub-periods, and a Kelly backtest returning +21% to +145% across every shock window at Sharpe 2 to 4. Too good, so we triple-checked, and the third check found it: the code that merged the daily data had stamped each series' 4 p.m. closing value onto that same day's morning bar. On a March-2020 crash day the morning bar already carried the afternoon's panic — a six-and-a-half-hour look into the future, on every bar.
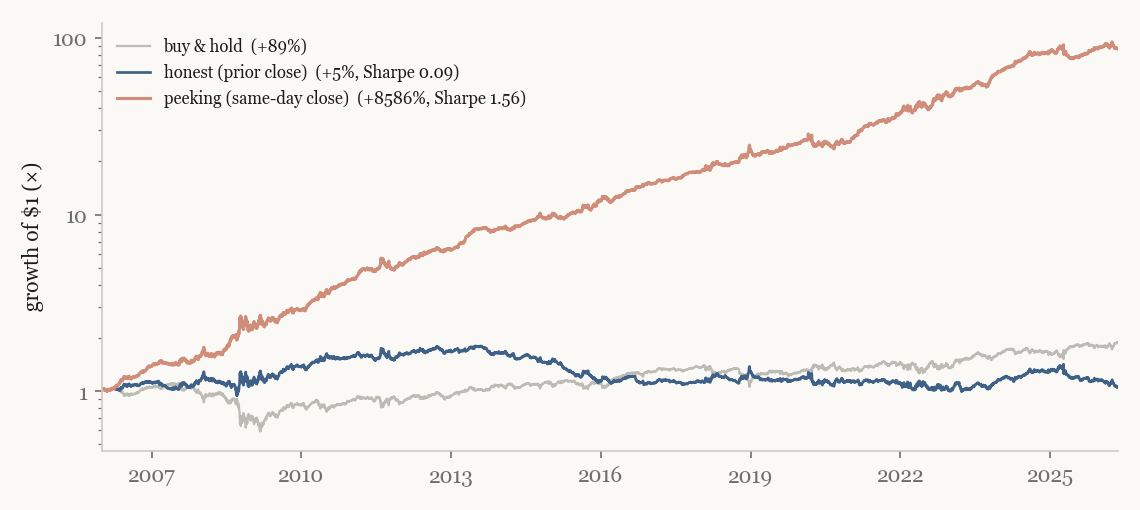
The champion was the bug. Once the timestamp was corrected its edge fell apart:
| The "too-good" champion | before the fix | after the fix |
|---|---|---|
| signal strength (pooled) | +9.47 | +2.01 |
| worst sub-period | +8.87 | +1.41 |
| cross-window Kelly backtest | +21% to +145%, Sharpe 2–4 | collapses |
Everything built on the contaminated merge went in the bin. The redo had a dividend: chasing the data we found that the index series we'd been about to pay a vendor for are published free, and rebuilt the whole feature set — forty-odd series — on a clean archive, leaving us better supplied than the bug found us.
The thing that didn't go away
Re-screening on clean data turned up a sturdier lead feature, but also the problem that outlasts this week: the relationship reverses across 2020. The reading that used to precede strength now precedes mild weakness — deep contango was bullish before 2020 and slightly bearish after. Same number, opposite meaning. No regime model can hold a stable view across a break like that if the thing generating the data changed, and this is the first clear sign that it did.
What the week produced
No forecaster. What it produced is an apparatus that fools us less than it did: a scorecard that grades the future instead of the past, a data path that doesn't peek, and a clear account of where the edge is and isn't. It lives in calling stress, not in clearing it; sizing won't fix that, and the feature it leans on is changing its meaning over time. Explaining the past is easy and pays nothing. Predicting the future is the only thing that pays, and the week mostly taught us how much we had been flattering ourselves about which one we were doing.