
Eight Regimes: A Rule-Based Volatility Strategy
This is a rule-based strategy for trading SPY around the volatility environment. It is mostly long, and its whole job is to decide how much exposure to carry given where volatility sits. Every position it takes can be read straight off an explicit rulebook — there is no model to interrogate, only thresholds and transitions.
The design has three layers — sort the market into one of eight regimes, model how those regimes transition, and size each regime with Kelly — wrapped in a few pieces of signal processing.
The three signals
Everything starts from three signals, all built from cheap, public data:
- Term structure — the ratio VIX3M / VIX. Above 1 the curve is in contango
(calm); below 1 it is in backwardation (stress).
- Term-structure slope — whether that ratio is trending up (calming) or down
(toward stress), as a rolling slope.
- Consumer-sentiment slope — consumer-discretionary over consumer-staples
(XLY / XLP) as a risk-appetite proxy, again as a slope.
Each signal is reduced to a binary — contango vs backwardation, rising vs falling, sentiment rising vs falling — and two × two × two gives eight regimes.
The eight regimes
| # | Term structure | Ratio slope | Sentiment |
|---|---|---|---|
| 0 | Contango | up | up |
| 1 | Contango | up | down |
| 2 | Contango | down | up |
| 3 | Contango | down | down |
| 4 | Backwardation | up | up |
| 5 | Backwardation | up | down |
| 6 | Backwardation | down | up |
| 7 | Backwardation | down | down |
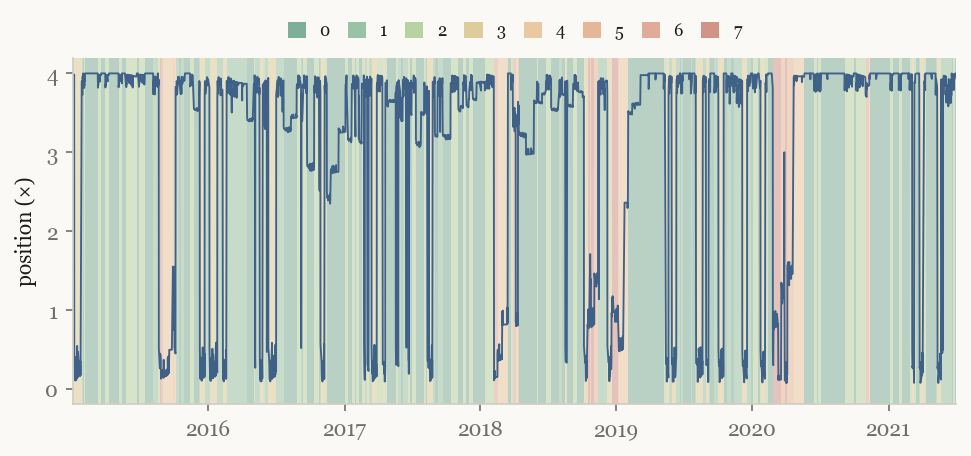
Regime 0 is the calmest — contango, improving, risk-on; regime 7 is the worst — backwardation, deteriorating, risk-off. Because size is decided per regime, the strategy can lean in during 0 and stand aside during 7.
Smoothing the inputs: a gated Kalman filter
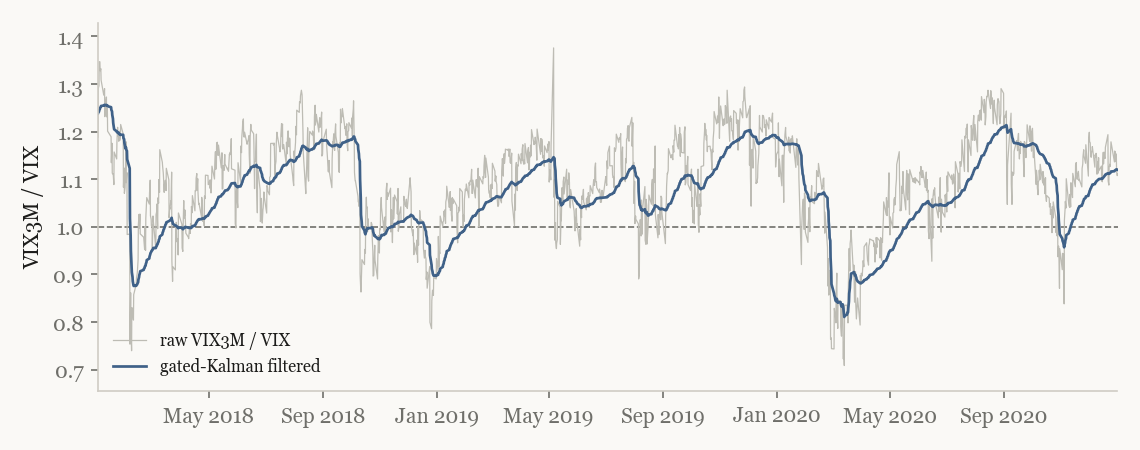
Raw volatility series are noisy, and naive smoothing lags exactly when you need it not to. Each input runs through a gated Kalman filter instead. In calm markets the process-noise term is tiny, so the filter is heavily smoothed; when an innovation — the surprise between prediction and observation — exceeds a z-score trigger, the process noise jumps, the filter's gain rises, and it snaps toward the new level. The chart above is the effect: a smooth signal that still catches the COVID dislocation in days rather than averaging straight through it.
Regimes move: an age-dependent Markov model
Regimes are not independent draws; they persist and hand off to one another. The strategy estimates an 8×8 Markov transition matrix — the probability of moving from each regime to each other — re-estimated periodically from history.
A plain transition matrix ignores how long you have already been in a regime, so the strategy adds an age-dependent layer: the probability of leaving is conditioned on the regime's current duration (a survival-analysis view), and where that conditional estimate is data-starved it is shrunk back toward the global average by a Bayesian weight. The output is a forward distribution over the next regime that respects both the typical transition and the current regime's age.
Sizing: per-regime Kelly
Each regime keeps its own book of realised forward returns. For each, the strategy solves numerically for the Kelly-optimal leverage — the fraction that maximises expected log-growth — subject to a leverage cap and a ruin limit derived from the worst return ever seen in that regime. The position actually taken is the transition-probability-weighted average of those per-regime Kelly sizes, scaled down by a fractional-Kelly factor for safety. In short: size by what the regimes you are likely to occupy next would each justify, then de-risk.
Letting winners run: the golden path
Rather than a fixed take-profit, the strategy stores the cumulative-return path of every winning trade, per regime, and averages them into a "golden path" — the typical shape of a winning trade in that regime, with a peak. The exit target is set relative to that peak and moves with how far the current trade has already run. It behaves less like a hard profit target and more like a disciplined "ride to the regime's usual peak, then leave."
Regime character: DFA-Hurst
As a diagnostic, the strategy stitches together the returns inside each regime and runs detrended fluctuation analysis to estimate a Hurst exponent, labelling each regime persistent (trending), anti-persistent (mean-reverting), or a random walk. It is descriptive rather than a trading input — a check on whether the eight regimes actually behave differently from one another.
A crisis, end to end
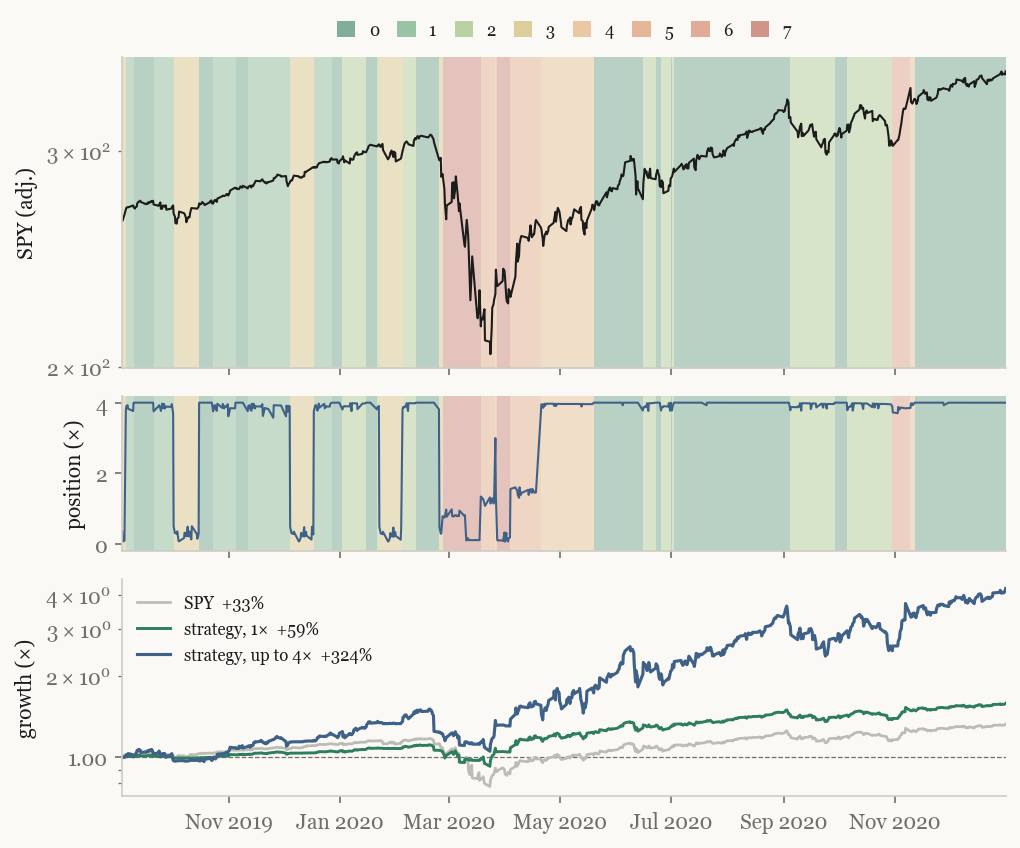
Putting it together, here is the strategy through the COVID crash — a reconstruction at the strategy's native two bars per day (9:30 / 16:00). The model is warmed up walk-forward from mid-2006, the inception of VIX3M, so by this window the per-regime Kelly books and transition matrix already carry about thirteen years of history, 2008 included. The data cadence, signals, regimes and Kelly sizing are reproduced faithfully; only the trajectory take-profit overlay is omitted.
Known problems
Writing the rulebook out in full makes its weak points obvious:
- It is long-only. Even in regime 7 — backwardation, deteriorating, risk-off —
it never shorts; it only sizes down. It can step out of trouble but cannot profit from it, and it has no special machinery for timing the recovery.
- The regimes are hand-designed. The thresholds and the eight-way split were
chosen by looking at the data, which is selection bias. There is no hard out-of-sample test yet, and no statistical test that the eight regimes actually have different forward returns.
- No transaction costs, so the backtest flatters itself.
- The sentiment slope is noisy at a short window and churns the regime label.
The deepest of these is the hand-design itself: regimes chosen by eye tend to backtest well and then underwhelm out of sample. The natural next step is to stop setting the regimes by hand and let a model infer them from the data.